


Bulletin E2011
Managing the Nutrition of Highbush Blueberries
DOWNLOAD
September 26, 2016 - Eric Hanson
 Print
Print Email
EmailBlueberries evolved under acidic soil conditions where levels of many nutrients are naturally low. Generally, bushes require little and are sensitive to too much fertility. Because of these unusual nutrition requirements, many fertilization practices common to tree fruit production are not appropriate for blueberries. Proper management of nutrition is particularly important in blueberry culture because most blueberries in Michigan are grown on sandy soils that are prone to leaching. Sites usually have a water table within 3 feet of the soil surface, so nutrients can potentially move into drain water or groundwater. Efficient use of fertilizers will reduce production costs and minimize adverse effects on water quality.
This bulletin describes the diagnosis of problems related to nutrition, commonly used fertilizers and techniques for correcting nutritional problems.
Symptoms of Nutritional Problems
Nutrient deficiency and toxicity symptoms are useful in diagnosing specific problems, though accurate diagnoses can be difficult because similar symptoms may be caused by a variety of stresses (e.g., water, herbicides, nutrition, etc). Basing fertilization practices on symptoms and bush appearance alone is not advised because symptoms indicate acute nutrient shortages that may have already reduced yield or bush health.
Nitrogen (N). Inadequate N limits bush growth. New shoot growth is reduced and often only one flush of growth occurs. Few new canes are initiated. Leaves are pale green (chlorotic) rather than the lush, dark green of adequately fertilized plants. The chlorosis is uniform across the leaf, with no mottling or pattern. The older, lower leaves usually develop the pale color before younger leaves at the tops of shoots. Leaves of deficient plants often develop fall colors and drop off early. Yield is usually reduced.
Excessive N causes abundant, vigorous shoots and large, dark green leaves. Bushes may produce several growth flushes, the last of which may be too late to harden off properly before winter. Tips of these shoots are often winter-killed. Bushes receiving too much N often produce lower yields of small, late-ripening berries.
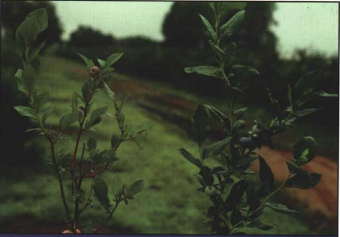
Figure 1. Nitrogen deficiency symptoms (left) compared with adequately fertilized branch (right). Note the pale green color, small leaves and shortened shoots.
Phosphorus (P). Symptoms of P deficiency are not commonly seen on field plants. In addition, field plants seldom respond to P applications. Deficient plants may be stunted and have small leaves. Leaves may be tinted dark green to purple, particularly on the tips and margins. Leaves may lie unusually flat against the stems. Twigs are narrow on deficient plants and may also exhibit a red-purple color. Symptoms of excessive P have not been reported, but very high P levels may cause iron (Fe) deficiencies by inhibiting uptake.
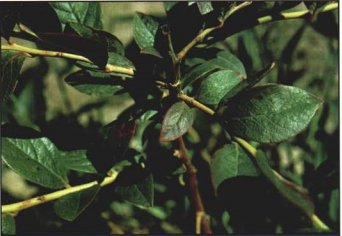
Figure 2. Dark green-purple color of phosphorus-deficient leaves.
Potassium (K). Potassium deficiency causes a dieback of the tips of shoots. Leaves may develop several symptoms, including scorching along the margins, cupping and curling, and necrotic spots. Younger leaves toward the tips of shoots may develop interveinal chlorosis similar to that caused by iron deficiency.
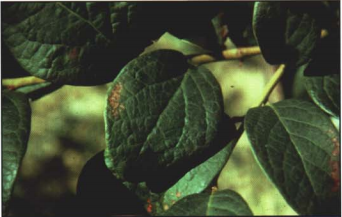
Figure 3. Scorching or necrosis along margins of leaves caused by potassium deficiency.
Magnesium (Mg). Symptoms of Mg deficiency are seen periodically in commercial plantings. A distinctive pattern of chlorosis develops between the main veins of leaves. These regions may turn yellow to bright red while tissue adjacent to the main veins remains green. Leaves at the bases of canes and shoots show symptoms first. Young leaves at the tips of shoots are seldom affected.
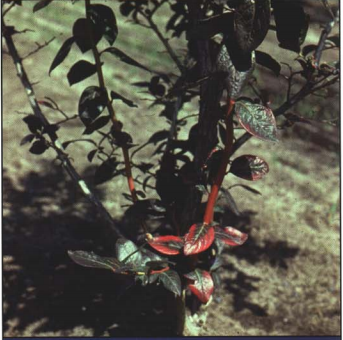
Figure 4. Outer portions of magnesium-deficient leaf turns yellow to bright red, while middle of leaf remains green. Symptoms usually develop later in the season on leaves at the bases of shoots.
Boron (B). Deficiencies have not been seen in Michigan, but reported symptoms include a dieback of shoot tips. Leaves close to aborted shoot tips develop a mottled chlorosis and cupping. Flower and vegetative buds may fail to open on severely affected plants.
Iron (Fe). Symptoms of Fe deficiency are common in blueberries. Deficiency causes the tissue between veins to develop a light yellow to bronze-gold chlorosis. Symptoms differ from those associated with Mg deficiency in that the main veins and many minor veins remain green in Fe-deficient leaves. Symptoms normally appear first on the youngest leaves toward shoot tips. Shoot growth and leaf size are reduced.
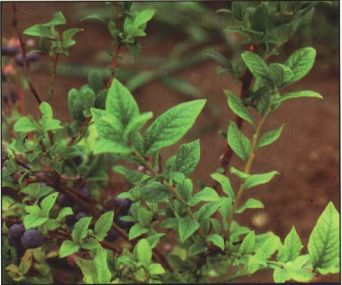
Figure 5. Iron-deficient plants have chlorotic leaves with green veins. Symptoms develop first on the young leaves at the shoot tips.
Calcium (Ca), Sulfur (S), Copper (Cu), Manganese (Mn) and Zinc (Zn). Deficiencies of these nutrients have not been reported on field-grown blueberries, but symptoms have been induced by removing nutrients from plants experimentally. Ca deficiency causes an interveinal chlorosis on young leaves and scorching of the margins of older leaves. Young bushes deprived of S develop leaf symptoms similar to those caused by N deficiency, including a uniform chlorosis (no pattern or mottling). Symptoms of Cu and Mn deficiency are similar and include interveinal chlorosis and shoot dieback in severe cases. With Mn deficiency, regions near the leaf margin may die, as well as isolated spots throughout the leaf Zn deficiency causes a uniform yellowing of young leaves (no interveinal pattern) that develops early in the season.
Testing Soils and Interpreting Results
Soil testing is a valuable part of blueberry nutrition programs. Soil pH needs to be monitored periodically because pH influences the availability of many nutrients to plants. Blueberries require relatively small amounts of most nutrients, and most soils can supply adequate quantities if the pH is maintained in the proper range.
Soil tests also provide estimates of the quantities of P, K, Ca and Mg that are available to plants. Soil tests, however, provide only crude estimates of nutrient availability to plants.
MSU and several private labs offer soil testing services. MSU Extension staff members can interpret sample results from other labs to provide MSU recommendations.
Preplant sampling. Collect soil samples 1 or 2 years before planting to provide adequate time to adjust pH, if necessary. Collect an adequate number of soil samples to represent the proposed site. Soil pH or nutrient levels can vary greatly over short distances. As a general rule, collect at least one sample per 10 acres on uniform sites with little visible variation in soil characteristics. If soil organic matter, texture or previous crop history varies, sample each distinctly different area separately. Four to six samples may be needed to adequately characterize a variable 10-acre site. Each soil sample submitted for analysis should be a composite of 20 to 40 subsamples taken from throughout the area.
Blueberries may root to depths of 12 to 16 inches, so sample soil to these depths, if practical. Shallow sampling may give misleading information if pH or nutrient levels vary with depth.
Sampling established plantings. Sample soil from existing plantings every 3 to 4 years. All plantings may be sampled the same year or portions may be sampled more frequently on a rotating basis. Collect soil from within the row to a depth of 8 to 10 inches. Sample at any convenient time of year.
Soil sampling is particularly important where the soils have been acidified. If the acidifying agent was applied to the soil surface and not incorporated, pH will likely increase with depth. Collecting se3parate topsoil (0 to 8 inches) and subsoil (8 to 16 inches) samples will provide a better understanding of whether the soil has been acidified adequately. Acidified soils often increase in pH over time, so these plantings need to be monitored more frequently than sites on naturally acidic soils.
Interpretation. The pH of blueberry soils should be adjusted if needed. Blueberries may perform well when soil pH is between 4.0 and 5.5, but 4.5 to 5.0 appears to be best. Apply lime at rates recommended on the soil test report if the pH is below 4.0. if the soil Mg level is also low, use dolomitic lime. If lime rates are not given and pH is below 4.0, apply 1,000 lb lime/acre on sandy soils, 2,000 lb on loam soils or 4,000 lb on muck soils.
If soil pH is greater than 5.5, apply adequate elemental sulfur to decrease pH to 4.5 (see Table 1). The amount of sulfur required is very dependent on soil texture. Relatively little sulfur is needed on sands, whereas soils high in clay or organic matter require much more. It is important to apply and incorporate sulfur a year before planting to allow the sulfur time to react. Sulfur cannot be incorporated to change pH quickly after plants are present. If large changes in pH are needed, check soil pH again just before planting and apply additional sulfur if needed. Do not apply more than 400 lb sulfur per acre to established plantings at one time. When large amounts are needed, spread the application out over several years. Ferrous sulfate and aluminum sulfate also decrease soil pH, but they are more costly to use than sulfur.
Table 1. Elemental sulfur1 needed to lower pH to 4.5 (lb/acre).
|
|
Soil Type |
||
|
Current pH |
Sand |
Loam |
Clay |
|
5.0 |
175 |
530 |
800 |
|
5.5 |
350 |
1030 |
1600 |
|
6.0 |
530 |
1540 |
2300 |
|
6.5 |
660 |
2020 |
3030 |
|
7.0 |
840 |
2560 |
3830 |
1To substitute aluminum sulfate, multiply by 6; ferrous sulfate, multiply by 8.
P and K recommendations based on soil test results are given in Table 2. Sufficient soil test levels are greater than 50 ppm K (all soils) and 40 ppm P (mineral soils) or 30 ppm P (organic soils). These soil P and K levels are general guides—lower levels may supply adequate amounts to bushes. Soil levels do not predict plant responses with certainty.
Table 2. Potash and phosphate recommendations.
|
|
Recommended rate (lb/acre) |
||
|
Soil test (ppm)* |
K2O |
P2O5 |
|
|
|
All soils |
Mineral soils |
Organic soils |
|
0-10 |
90 |
150 |
100 |
|
10-20 |
75 |
125 |
75 |
|
20-30 |
60 |
100 |
50 |
|
30-40 |
30 |
50 |
0 |
|
40-50 |
20 |
0 |
0 |
|
>50 |
0 |
0 |
0 |
*To convert ppm soil test to lb per acre (to 6.7-inch depth), multiply by 2
Mg may be needed if soil Mg is low in absolute maounts or relative to levels of Ca and K. Mg applications are recommended if soil Mg levels are less than 40 ppm Mg on mineral soils and 75 ppm on organic soils. High Ca and/or K reduces Mg absorption and may also indicate a need for Mg. The relative proportions of Ca, Mg and K are expressed on the MSU Soil Test Report as the percent of bases. If Mg represents less than 4 percent of the bases of if K exceeds Mg as a percent of bases, Mg applications are recommended. Desirable ranges of the percent of bases are 60 go 80 percent Ca, 15 to 30 percent Mg and 10 to 15 percent K.
Leaf Analysis
Leaf analysis is a valuable and often underutilized tool in blueberry nutrition programs. It provides a means of accurately identifying nutritional problems that are difficult to diagnose by soil testing or observing bush appearance. More importantly, growers can identify and correct potential nutrient shortages before growth or yield is affected.
Procedures. As with soil samples, one tissue sample should not represent more than 10 acres. If possible, sample different varieties and blocks on differing soil types separately. For routine monitoring, sample bushes every 3 to 4 years. On larger farms, different blocks may be sampled during successive years on a 2- and 4-year cycle.
Each sample should consist of 50 to 100 leaves collected from different bushes throughout the sampling area. Collect leaves from the middle of current-season shoots between mid-July (southern Michigan) and mid-August (northern areas). Wash leaves by swirling them in a dilute detergent solution for several seconds, then rinse briefly in tap water. Let leaves air-dry on a table top for 1 to 2 days before sending them to the lab—wet or moist leaves will rot during shipping.
If the purpose of leaf sampling is to diagnose a suspected nutrient problem, it is often helpful to submit two samples—one from bushes beginning to develop the problem and a second from nearby healthy bushes.
Although laboratories may us different procedures for analyzing leaf samples for mineral nutrients, results from reputable labs should be identical. Labs may offer analysis of single nutrients, such as N, but the cost of complete analyses is usually not that much more.
Interpretation. Leaf analysis results are interpreted relative to a critical or deficient level for each nutrient. When leaf concentrations are below the critical level, bushes are likely to respond to nutrient applications (Table 3). Sufficient levels are the normal range seen in healthy, productive bushes that are not expected to respond to nutrient additions. Usually there is a difference between the deficiency level and the lowest concentration that is considered sufficient. Bushes containing leaf levels between the deficient and sufficient ranges would not be expected to respond to nutrient applications but should be monitored closely. Deficient and sufficient levels for some nutrients have been researched extensively and are well understood. The requirements of other nutrients—such as B, Cu, Mn, S and Zn—are not as well understood. Deficient and sufficient levels of these nutrients may change slightly as more information is available. Concentrations of several nutrients in leaves change over development. If samples are collected earlier or later than normal, consider seasonal changes when interpreting results.
Table 3. Deficient, sufficient and excessive nutrient concentrations in blueberry leaves.
|
Nutrient |
Deficient below |
Sufficient |
Excessive above |
|
N (%) |
1.7 |
1.7-2.1 |
2.3 |
|
P (%) |
0.08 |
0.08-0.4 |
0.6 |
|
K (%) |
0.35 |
0.4-0.65 |
0.9 |
|
Ca (%) |
0.13 |
0.3-0.8 |
1.0 |
|
Mg (%) |
0.1 |
0.15-0.3 |
na |
|
S (%) |
na |
0.12-0.2 |
na |
|
B (ppm) |
18 |
25-70 |
200 |
|
Cu (ppm) |
5 |
5-20 |
na |
|
Fe (ppm) |
60 |
60-200 |
400 |
|
Mn (ppm) |
25 |
50-350 |
450 |
|
Mo (ppm) |
na |
na |
na |
|
Zn (ppm) |
8 |
8-30 |
80 |
na: information not available
Nitrogen. Maintain leaf N levels between 1.7 and 2.1 percent (dry weight basis) for optimum yields and fruit quality. Leaf N concentrations are often highest during heavy crop years—berries compete with and reduce vegetative growth so that leaf N is more concentrated. Plants growing poorly because of water problems or other stresses may contain high leaf N levels. Drought conditions usually increase leaf N concentrations. Leaf N levels decrease throughout the year, so samples collected earlier in the season will contain higher levels of N than leaves sampled later.
Phosphorus. Although most blueberry soils supply adequate P, application may be justified when leaf P levels fall below 0.08 percent. Leaf P concentrations are highest very early in the season and lowest at harvest time. Levels are not greatly affected by yearly variations in crop load or moisture supply.
Potassium. Leaf K levels below 0.35 percent indicate a need for K fertilizer. There is some evidence that blueberry bushes containing up to 0.5 percent K may benefit from K additions, but this is not always true. This confusion is likely the result of the strong influence that crop load has on leaf K levels. Fruit accumulate relatively large amounts of K, so leaf levels are always lower when bushes are bearing heavily and higher when a light crop is present. Leaf K levels between 0.35 and 0.4 percent are adequate if bushes are carrying a full crop of fruit. The same levels observed during a light crop of fruit. The same levels observed during a light crop year might be too low. Avoid over-fertilizing blueberries with K—excessive K inhibits Mg uptake. Leaf levels above 0.9 percent are excessive.
Calcium. Though blueberries are seldom if ever deficient in Ca, leaf Ca levels may provide insight into soil pH. Leaf Ca levels generally increase with soil pH. Leaf Ca levels can be strongly influenced by crop load (high Ca concentrations when crop load is heavy) and N fertilization (low leaf Ca in vigorous, heavily fertilized plants), so they may vary from year to year.
Magnesium. The deficiency level of 0.1 percent Mg is given for blueberry leaves (Table 3). However, there have been reports of Mg deficiency symptoms on bushes containing as high as 0.2 percent Mg. It is likely that bushes have higher optimum leaf Mg levels when leaf K levels are also high. Excessive leaf Mg levels (above 0.4 percent) usually indicate soil pH is too high.
Iron. Although Fe deficiency (chlorosis) is common in blueberries, leaf Fe levels have limited value in diagnosing this problem. Symptoms usually develop when leaf Fe approaches 60 ppm but may also appear on plants containing considerably higher leaf Fe. In other cases, plants containing less than 60 ppm Fe may exhibit no symptoms of deficiency.
Other nutrients. The general sufficient ranges and deficient levels for B, Cu, Mn, S and Zn (Table 3) were compiled from reported values in healthy plants and controlled studies on potted young plants. These are tentative.
Fertilizers and Rates
Each nutrients has several fertilizer sources. Choose the best fertilizer based on the cost per unit of nutrient and whether the material contains other needed nutrients. Most blueberry plantings require N applications each year, whereas other nutrients are generally applied only when a need arises. Common fertilizer sources for major nutrients are listed in Table 5, and micronutrient sources are given in Table 6.
Nitrogen fertilizers that supply N in the ammonium form are preferred over those supplying nitrate N because nitrate may injure blueberries. Urea is generally the best choice if the soil pH is less than 5.0. Urea is high in analysis (46 percent N) and usually the least expensive source per unit of N. Urea forms ammonium in the soil, so it is considered an ammonium source. If the soil pH is somewhat high (above 5.0), ammonium sulfate is the best choice. Though urea and ammonium sulfate tend to decrease pH, ammonium sulfate is the more acidifying of the two. If complete fertilizers (containing N, P and K) or blends are used, make sure the majority of the N is in the ammonium form.
General N application rate for blueberries of various ages are summarized in Table 4. Most manure plantings need 50 to 70 lb N/acre annually, but rates must be adjusted for soil type and site. Plantings on sandy soils low in organic matter will need higher rates; those on heavier soils high in organic matter require lower rates. Plantings mulched with sawdust or wood chips may need double the application rates recommended in Table 4 because most mulch materials tie up N, making it unavailable to the plants.
Table 4. Recommended rates of nitrogen (lb/A).
|
Years in field |
Actual N |
Urea (46% N) |
Ammonium sulfate (21%) |
|
8 |
65 |
150 |
300 |
|
6 |
45 |
100 |
215 |
|
4 |
30 |
70 |
150 |
|
2 |
15 |
35 |
75 |
Apply N between bud break and petal fall in the spring. Earlier applications may be wasteful because bushes cannot absorb soil N readily until leaves begin to grow. Blueberries are shallow-rooted and can absorb N quickly. Multiple applications will often increase the efficiency of N use, particularly on sandy soils where N can easily leach out of the root zone before bushes can use it. Split the annual rate into two or three equal portions and apply these in May and June. Do not fertilize plants later than July—it may stimulate late growth that is prone to winter injury.
Some growers prefer to supplement annual soil applications of N with foliar sprays during the season. Supplemental N sprays may benefit N-deficient bushes, but bushes receiving appropriate soil applications of N are unlikely to show a yield response to sprays.
Phosphorus can be applied if needed as a complete fertilizer or one of the sources listed in Table 5. Apply sources containing only P any time, but apply P sources containing N only in the spring. Use rates recommended on soil test or leaf analysis reports, usually 75 to 100 lb P2O5/acre.
Table 5. Fertilizer sources for major nutrients.
|
|
Analysis |
||||
|
Fertilizer |
N |
P2O5 |
K2O |
Ca |
Mg |
|
Ammonium sulfate |
21 |
|
|
|
|
|
Concentrated superphosphate |
46 |
|
|
|
|
|
Diammonium phosphate (DAP) |
17 |
50 |
|
|
|
|
Dolomitic limestone |
|
|
|
15-20 |
10-15 |
|
Gypsum |
|
|
|
22 |
|
|
Limestone |
|
|
|
30 |
|
|
Espom salts (magnesium sulfate) |
|
|
|
|
10 |
|
Monoammounim phosphate (MAP) |
11 |
48 |
|
|
|
|
Potassium-magnesium sulfate (Sul-Po-Mag) |
|
|
22 |
|
11 |
|
Potassium sulfate |
|
|
50 |
|
|
|
Superphosphate |
|
20 |
|
|
|
|
Urea |
46 |
|
|
|
|
If soil tests or leaf analysis indicate a need for K, apply potassium sulfate. Use Sul-Po-Mag if Mg is also needed. Potassium chloride (muriate of potas) is an inexpensive source but should be used with caution—blueberries are sensitive to the chloride in this material. If high rates are used or the material is applied to young plants or not spread uniformly, damage can occur. Rate of 50 to 100 lb K2O/acre will correct most shortages. Apply K anytime during the year.
If Mg is needed, consider the soil pH when choosing the proper source. Dolomitic lime is the least expensive Mg source, but it should be used only if soil pH is less than 4.5. if Mg is needed but pH, such as magnesium sulfate (Epsom salts) or Sul-Po-Mag. Apply enough fertilizer to supply 50 lb Mg/acre.
If soil tests indicate Ca is needed, soil pH is nearly always too low as well. Apply limestone or dolomitic limestone at recommended rates (usually 1,000 to 2,000 lb/acre). Occasionally Ca levels may be low when pH is in the proper range. Gypsum is a good Ca source in this situation because it does not change pH.
Micronutrient deficiencies are not common in Michigan blueberries unless the soil pH is too high. Symptoms of Fe deficiency are usually the first indicator of improper soil pH, though pH also influences the availability of B, Cu, Mn, Mo and Zn to plants. For this reason, most micronutrient problems can be corrected permanently by simply adjusting soil pH to the proper range.
Micronutrient applications may be needed to supply plants until soil pH responds to corrective measures or occasionally when micronutrient shortages are the result of low soil supply rather than improper pH. Some common micronutrient sources and application suggestions ore summarized in Table 6. Remember that soil applications of Fe, Mn or Cu materials are seldom helpful on soils with high pH levels—applied materials become tied up and unavailable. For this reason, soil applications of iron sources seldom benefit Fe-deficient plants. Do not apply micronutrients unless leaf analyses or symptoms indicate a clear need. Excessive applications of micronutrients (boron, in particular) can damage plants and are an unnecessary expense.
Table 6. Suggested micronutrient sources and application techniques.
|
|
|
Method |
Timing |
Rate |
|
Boron |
Solubor (20% B) |
Foliar1 |
Summer |
1.5 lb/acre |
|
|
|
Ground2 |
Anytime |
5 lb/acre |
|
Copper |
Copper sulfate (25% Cu) |
Foliar |
Summer |
1 lb/acre |
|
Iron |
Iron chelate (2-12% Fe) |
Foliar |
Summer |
Label rates |
|
Manganese |
Manganes Chelate (2-8% Mn) |
Foliar |
Summer |
Label rates |
|
|
Manganese (32% Mn) |
Foliar |
Summer |
2 lb/acre |
|
Zinc |
Zinc chelate (1-10%) |
Foliar |
Summer |
Label rates |
1Foliar sprays can be applied in 100 to 200 gallons water/acre
2Apply in 20 to 50 gallons water with weed sprayer
Organic nutrient sources. Livestock manure and manure/bedding mixtures can be useful sources of nutrients for blueberries. The nutrient content of manure needs to be known to calculate appropriate application rates. Nutrient concentrations in manures vary enormously, depending on the animal species and feed, presence of bedding or other additions, and handling procedures. As a result, specific materials need to be analyzed to determine nutrient content and application rates. Manures contain organic N and ammonium N. Generally, all of the ammonium N and 25 to 50 percent of the organic N will be available to bushes the year of application. Adjust manure rates so that the available N does not exceed recommended N rates. The nutrient content of plant residues such as straw, bark and sawdust is minimal. Usually nitrogen rates need to be increased by 50 to 100 percent where these materials are used because the microbes that decompose these plant residues may have relatively high N demands.
Record keeping. Detailed record keeping is highly recommended. Records allow growers to learn from experiences and gain understanding of crop nutrient needs. Records will also be useful if a grower’s management practices are challenged. Keep annual records on individual fields, including soil test and tissue analysis reports, growth and yield observations, and the dates, quantities and analysis of fertilizers applied.
Related Publications
Lime for Michigan Soils. 1993. Extension Bulletin E-471, Michigan State University, East Lansing, Mich.
Costs of Producing Blueberries in Southwest Michigan. 1992. Extension Bulletin E-2192, Michigan State University, East Lansing, Mich.
Highbush Blueberry Varieties for Michigan. 1980. Extension Bulletin E-1456, Michigan State University, East Lansing, Mich.
Blueberry Diseases in Michigan. 1989. Extension Bulletin E-1731, Michigan State University, East Lansing, Mich.
Hints on Growing Blueberries. 1986. Extension Bulletin E-2066, Michigan State University, East Lansing, Mich.
Pruning Blueberries. 1987. Extension Videotape VT019, Michigan State University, East Lansing, Mich.
Record Keeping System for Crop Production. 1992. Extension Bulletin E-2340, Michigan State University, East Lansing, Mich.
Generally Accepted Agricultural and Management Practices for Nutrient Utilization. 1995. Michigan Commission of Agriculture, Lansing, Mich.


