Ten fundamentals about bioenergy: Part 8
Editor’s note: This article is from the archives of the MSU Crop Advisory Team Alerts. Check the label of any pesticide referenced to ensure your use is included.
Fundamental #8: Bioenergy feedstock crops have a wide range of energy efficiency ratings.
This is the eighth in a series of articles on bioenergy. The previous
installment focused on the need to have a broad range of bioenergy crops
available to best fit local growing conditions, markets, biorefinery
needs and environmental constraints. This article will focus on the
inherent variability in the energy efficiency of various bioenergy
feedstock crops. Biofuels have the potential to be cost competitive with
fossil fuels. One metric used to compare the efficiency of a particular
bioenergy feedstock crop is based on the amount of energy the crop
produces in its final fuel form compared to the cost of the feedstock.
This metric is expressed as dollars per giga-Joule of energy produced ($
per GJ). For reference, a GJ is equivalent to 0.948 million Btu.
Recently, scientists (Lynd et al., 2008) estimated the cost of liquid
transportation fuels derived from cellulosic feedstocks to be at $3.00
per GJ compared to $8.70 for gasoline. Additionally, the authors project
costs of $13.80 and $6.60 per GJ for soy biodiesel and corn grain
ethanol respectively. Determining the best feedstock for biofuel
production is confounded by several issues. A wide disparity between
reported economic and energy input costs exists in the literature. My
own experience in working with farmers the past 20 years has shown a
tremendous diversity in management between farms and even between years
for the same farm. Decisions on which tillage operations to perform,
which and how much fertilizer, pesticide, and seed traits to use are
often based on a myriad of temporal economic, climatic, and
environmental factors and interactions. Biological systems, including
farming, are naturally fraught with variability. Therefore, significant
variability in the cost per GJ of bioenergy produced will continue to be
observed. However, some generalizations can be made. When comparing
enterprise cropping budgets for input costs and energy requirements,
several items consistently rank near the top. These include nitrogen
fertilizer, seed, and field machinery operations. Therefore, cropping
systems that minimize these primary input cost items while maintaining
yield will generally result in being more efficient on a cost per GJ of
bioenergy produced basis. For example, perennial grass crops such as
switchgrass have the potential for lower cost per GJ produced by virtue
of their perennial life cycle (lower planting costs since a stand will
last about 10 years) and lower nitrogen fertilizer costs (perennials
will translocate some nutrients to root system in fall) compared to an
annual grass crop such as corn. On soils responsive to reduced tillage,
switching to no-till management can improve economic and energy returns
with annual crops such as corn. Furthermore, the efficiency of annual
crop systems can be improved by double-cropping a winter annual biomass
crop such as winter cereal rye, with corn or soybean.
References
Lynd et al. 2008. How biotech can transform biofuels. Nature Biotechnology 26:169-172.
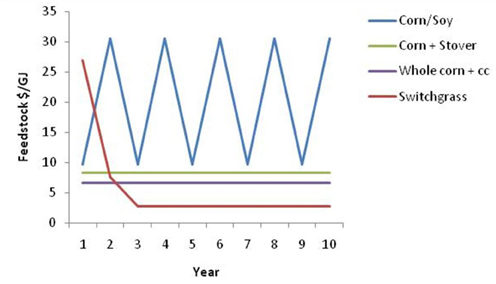
Figure 1 shows the estimated $ per GJ cost for several
bioenergy crop feedstocks grown under Michigan conditions. To date,
oilseed feedstocks for biodiesel such as soybean have tended to be less
competitive than starch feedstock for ethanol when evaluated on an
energy metric such as $ per GJ. This is primarily due to competition for
oilseed feedstock from food markets which drives the price for the
feedstock up. Additionally, the value of a co-product is not generally
factored into an energy-based metric such as $ per GJ. Because soybean
is considered more of a protein crop than a bioenergy crop, it tends to
compare less favorably with other crops when measured on its energy
value alone without regard to the value of the soymeal protein
co-products.

Read part 1, part 2, part 3, part 4, part 5, part 6, part 7, part 9, part 10 of this series.


 Print
Print Email
Email


